

Download the 2026 UK Regions Office Market report in full here →
STRENGTH IN THE REGIONS
With a mood of pessimism hanging over the UK economy in recent times, it would be easy to lose sight of the country’s strengths as a business location. However, the UK remains a genuine global leader in areas such as financial and professional services, technology, life sciences and the creative industries. The UK is also at the heart of the AI revolution, with Stanford University ranking it third in its Global AI Power Ranking, behind only the US and China.
While London has an undisputed status as a global commercial hub, much of the UK’s economic strength is forged in the regions. The UK’s regional office markets are home to the headquarters of innovators such as the Cambridge-based Arm and AstraZeneca, now the UK’s biggest and third-biggest companies by market cap respectively. Cornerstones of the UK economy such as BT, HSBC and BAE Systems employ tens of thousands in regional cities; while international giants with UK HQs in the regions include Microsoft, Oracle and PepsiCo in Reading; and BNY, Siemens and Adidas in Greater Manchester.
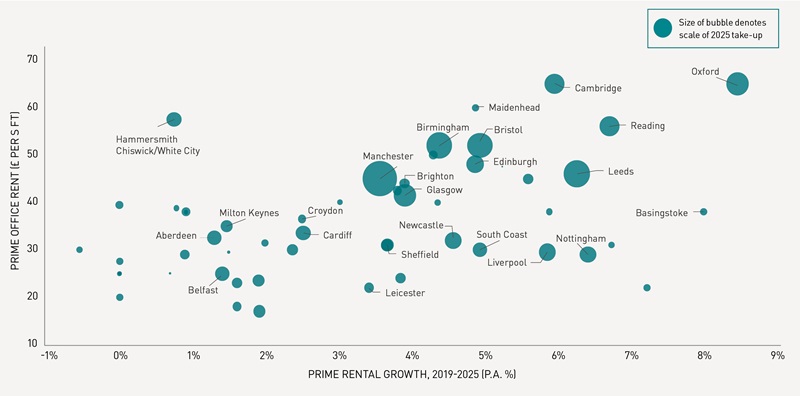
The structural difficulties that have impacted UK office markets in the post-COVID period are well documented, but the extraordinary rates of prime rental growth seen recently in major markets demonstrate that there remains a groundswell of strong occupier demand for the best regional office space. However, with the UK regions hosting a rich and diverse array of office markets, there are investment opportunities to be found even in locations where conditions are more challenging.
ASSESSING THE MARKETS
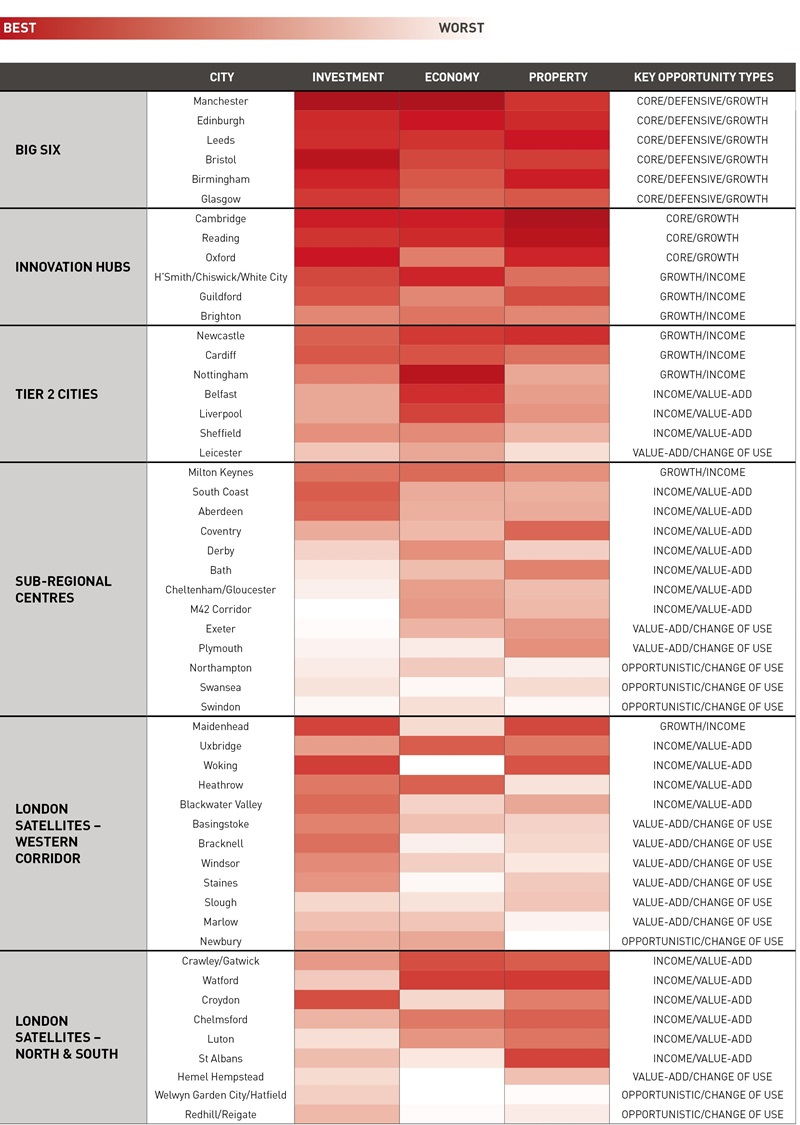
This article presents a heatmap showing where strengths lie across 53 UK office markets, based on scores given for 15 metrics across three pillars: Investment, Economy and Property. Drawing on the underlying data within these pillars, the heatmap then categorises the markets into groups with shared characteristics and identifies key opportunity types for each location.
The hottest markets in the Investment pillar are those with the greatest investor demand, liquidity and growth prospects. These are measured by prime office yields, office investment volumes, office deal counts, office investment per capita and prime rental growth forecasts.
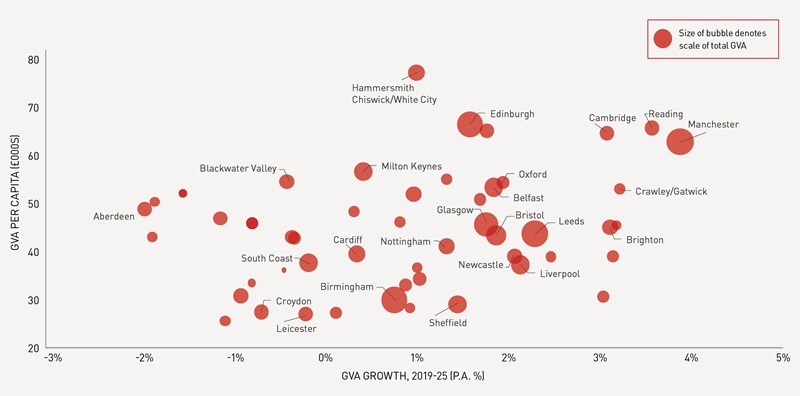
The top scorers for Economy are those with the greatest economic magnetism and business backdrops supportive to office demand. Metrics included are office-related employment levels and growth, GVA per capita and growth forecasts, service businesses growth, location-based retail spend and daytime population growth.
A high score in the Property pillar indicates both strong demand momentum for grade A space and limited excess availability. This draws from data on three-year office take-up compared with long term averages, prime & grade A share of total office take-up, years of office supply, five-year rental growth rates and the prevalence of properties rated EPC A/B.
BIG SIX SHOW STRENGTH
The UK’s Big Six office markets have a well-established place in the UK office hierarchy, and it is no surprise to see the heatmap showing their broad strengths across the three pillars. The Big Six are the largest and most liquid UK office investment markets outside London and they have been at the forefront of the recent occupier flight to best-in-class office space, resultantly seeing some of the strongest prime rental growth rates across the country.
However, there are variations between the Big Six markets, with Manchester standing out as the most well-rounded location across the three pillars. Investment into Manchester’s city centre over the last decade has driven high levels of economic and population growth, strengthening the argument for Manchester to be considered as the UK’s second most important business hub after London.
Edinburgh achieves its best score in the Economy pillar, while Bristol’s highest ranking is for Investment. Leeds is the top performer among the Big Six in the Property pillar, reflecting strong recent take-up and rental growth. Birmingham and Glasgow are both dragged down slightly by less dynamic economic metrics than the rest of the Big Six, but nonetheless the heatmap supports the case for the Big Six collectively to remain at the core of regional office investment strategies.
LSH REGIONAL OFFICE MARKET HEATMAP
Source: LSH Research, Experian Economics, Oxford Economics, Office for National Statistics, Nomis, PMA Property Market Analysis, Ministry of Housing, Communities and Local Government
REGIONAL ECONOMIC GROWTH DYNAMICS
Source: Oxford Economics, LSH Research
REGIONAL OCCUPIER MARKET DYNAMICS
Source: LSH Research
INNOVATION HUBS FLOURISH
Some of the other best performers on the heatmap are markets categorised as Innovation Hubs, with large clusters of science and/or technology occupiers. The UK’s two most celebrated Innovation Hubs, Cambridge and Oxford, are both very strong in both the Property and Investment pillars, reflecting the impact of their booming life sciences and tech sectors on recent occupier and investment market activity.
Reading, the key hub within the Thames Valley tech corridor, is another outstanding performer on the heatmap, showing strength across all three pillars. Indeed, Reading, Cambridge and Oxford all outscore several members of the Big Six on a number of key metrics. While they do not quite have the scale and liquidity of the Big Six, these three markets are now serious rivals to them as targets for core investment capital.
Other markets in the Innovation Hubs group are Hammersmith/Chiswick/White City, Guildford and Brighton. The economic vibrancy of these locations helps them to outscore most other locations of comparable size; albeit Hammersmith/Chiswick/White City is notably impacted by an overhang of office supply. All three have appeal as markets offering growth and income-driven opportunities.
TIER 2 CITIES PROVIDE OPPORTUNITIES
The UK’s Tier 2 Cities are characterised by large populations of 300,000-plus and act as major corporate and retail hubs within their regions. Newcastle is the best performer in this group, boosted by excellent results in the Property pillar that reflect strong recent take-up, a high concentration of grade A occupier demand and limited availability. Nottingham is another overperformer, due primarily to very strong results in the Economy pillar, including healthy forecasts for office employment and GVA growth.
All of the other Tier 2 Cities – Cardiff, Belfast, Liverpool, Sheffield, Leicester – perform best in the Economy pillar, suggesting that these are locations where occupier and investment market activity is generally a little below-par for the size and strength of the local economy. Leicester is a particular laggard, with a notably weak showing in Property pillar reflecting a distinct lack of grade A occupier activity and relatively low rents. With the Tier 2 markets showing a wide range of characteristics, they are home to varied opportunities, including assets suited to growth, income and value add strategies.
SUB-REGIONAL CENTRES A MIXED BAG
The UK’s Sub-Regional Centres are a notch down from the Tier 2 Cities in terms of their size and importance to their regional economies. This group has the most varied performance of any on the heatmap, as it includes several thriving economic hubs, but also some of the most challenged locations in the analysis.
Milton Keynes is the strongest performer in this category, reflecting robust economic forecasts, rental growth prospects and tight office availability. The South Coast also shows up well on the heatmap, boosted by healthy Investment metrics; while Coventry is another good performer, with its score in the Property pillar underpinned by strong three-year take-up.
In contrast, Northampton, Swansea and Swindon are anaemic performers across all three pillars. Sluggish Property and Investment metrics indicate that these locations may be most suited to opportunistic or change of use strategies.
LONDON SATELLITES HAVE VARIED STRENGTHS
A mixed bag of markets are also found in the London Satellite markets. However, proximity to the UK capital is generally supportive to these locations’ scores across the three pillars and, on average, these are stronger performers than the Sub-Regional Centres.
Several of the London Satellites have been boosted by the recent solid performance of their office occupier markets, with Maidenhead, Watford, St Albans and Woking all scoring well in the Property pillar due to healthy take-up, concentrations of grade A activity and positive rental growth. In contrast, occupier market activity has been tepid in markets such as Bracknell, Welwyn Garden City/Hatfield, Newbury and Redhill/Reigate, and these all have large supply overhangs, which may be ripe for repositioning or change of use.
Elsewhere in the London Satellites, Uxbridge, Crawley/Gatwick and Heathrow are notably strong markets in the Economy pillar, with airport-related activity boosting the latter two. Croydon, Woking and Blackwater Valley all have their best scores in the Investment pillar, reflecting relatively high levels of investor demand and liquidity.
SIFTING FOR OPPORTUNITIES
The UK regional office markets shown on the heatmap are markedly heterogeneous, ranging from cities of true global importance to smaller centres more reliant on localised demand. While the heatmap displays the obvious qualities of the Big Six cities and the Innovation Hubs of Cambridge, Oxford and Reading, pockets of strength are shown elsewhere with other locations such as Newcastle and Nottingham being highly ranked in individual pillars.
Although there are markets on the heatmap that show ostensibly much weaker metrics, this is a sign that these locations are likely to be home to well-priced value-add and opportunistic assets. As the UK regional office market enters a more stable phase, with capital values steadying and investment volumes beginning to recover, now is an excellent time to sift the markets for opportunities of all types, with pricing still very attractive in a long-term context.
Download the 2026 UK Regions Office Market report in full here →
Related Content


REGISTER FOR UPDATES
Get the latest insight, event invites and commercial properties by email