2025 Occupier Market Overview
2024 was unremarkable for take-up, but the year ended strongly, boosted by a flurry of large format deals in Q4. While a sluggish economy and continued geopolitical uncertainty could weigh on activity in 2025, occupiers’ flight to quality and an easing down of spec development will continue to put upward pressure on rents.
Q4 TO THE RESCUE
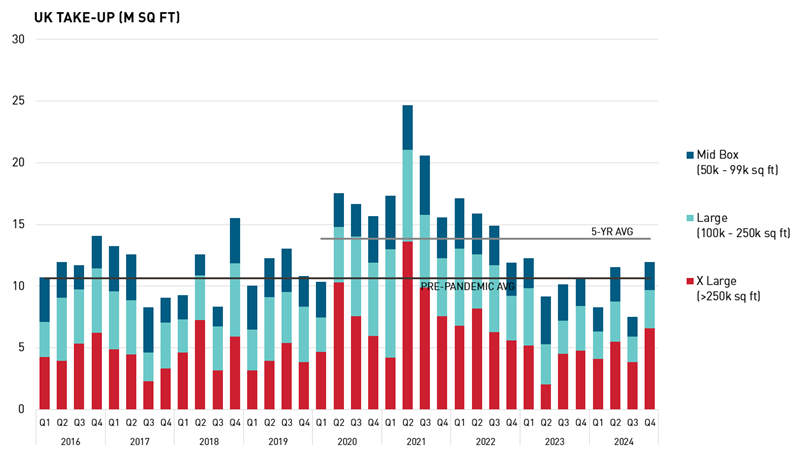
At 39.3m sq ft, UK-wide take-up in 2024 was mired by two particularly subdued quarters, resulting in the lowest annual total since 2012. That said, take-up was only 7% down on 2023 and 8% below the pre-pandemic average, reflecting less expansion-led demand alongside economic headwinds. Positively, the year ended strongly, with a flurry of major deals in Q4 driving the strongest quarterly take-up since Q1 2023.
All size segments saw below-trend take-up in 2024, although subdued activity in the large segment (100k-250k sq ft) weighed most heavily on the overall total, with take-up down 24% year-on-year and 41% below the five-year average. In contrast, the XL segment (>250k sq ft) was the most resilient, with take-up rebounding by 22% year-on-year and only 21% below the five-year average. This was boosted by the return of ‘mega deal’ activity, with four deals above 1m sq ft transacting in 2024, compared with only one in 2023.
Source: LSH Research
FOCUSED ON QUALITY
Flight to quality continues to shape demand, with facilities that boast ESG credentials and high energy efficiency providing a focus of occupier requirements. UK-wide take-up of grade A space was closely in line with 2023’s level and accounted for a record 73% proportion of 2024’s total take-up. On the flipside, continued aversion to poorer quality space saw take-up of second-hand space fall to its lowest level on record in 2024.
Within the grade A category, take-up of up-and-built supply amounted to 14.8m sq ft in 2024, rising 2% year-on-year and supported by an improved choice of new build spec-built options. However, underlining the need for bespoke options from some occupiers, design and build take-up of 13.7m sq ft was notably resilient, standing only 14% below the five-year average.
RETAIL REVIVED
While sectoral demand has been more evenly distributed since the pandemic boom, retail and wholesale rose to greater prominence again in 2024. The sector returned to dominate demand, accounting for 43% of take-up in 2024, rising from only 30% in 2023. This included major build-to-suit mega deals from the likes of Frasers Group, Nike, and Amazon.
Manufacturing accounted for the next largest share of take-up, although its share dropped from 28% in 2023 to 20% in 2024. Scotland was home to the largest manufacturing deal, with Sumitomo Electric committing to a new facility to manufacture undersea electricity for offshore wind farms. Third-party logistics operators followed closely behind with a 17% share of take-up in 2024, boosted by major commitments from Yusen Logistics and Ceva Logistics in Northamptonshire.
MIDLANDS MOST RESILIENT
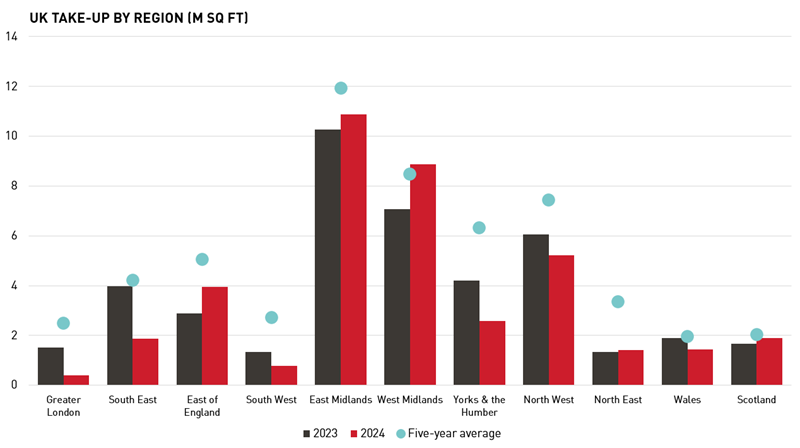
Despite the overall fall in demand in 2024, five of the UK’s eleven regions recorded improved take-up year-on-year. The East Midlands and West Midlands saw take-up rebound by an impressive 37% and 26% respectively. However, the West Midlands was the only region to see take-up ahead of the five-year average, while the East Midlands and Scotland were the only regions to have take-up within 10% of trend. Greater London endured an annus horribilis, with take-up 84% below average and devoid of any deals over 100,000 sq ft.
Source: LSH Research
SECONDHAND SUPPLY SOARS
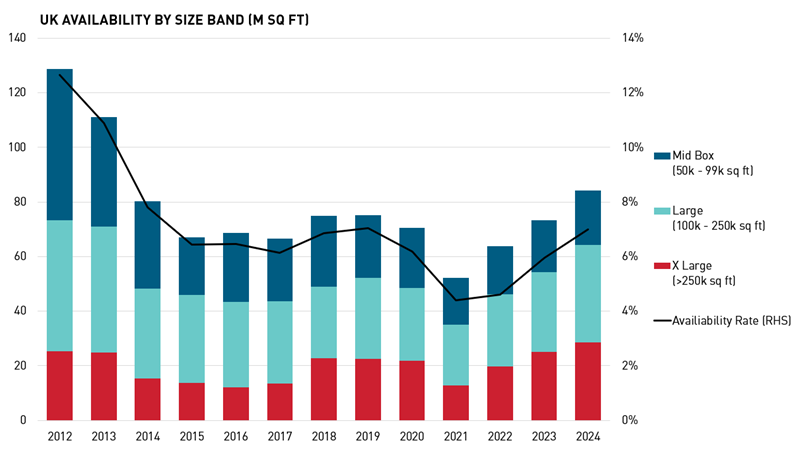
UK-wide supply increased for a third successive year to reach 84.2m sq ft at the end of 2024, a rise of 15% year-on-year. However, UK supply remains relatively balanced in its historical context, equivalent to 1.5 years of average annual take-up, with the availability rate climbing from 5.9% to 7.0%. Grade A space continues to dominate supply, accounting for 63% of the total, albeit its share fell from an all-time high of 67% in 2023.
While speculative development fuelled increased supply over the previous two years, secondhand space drove the increase in 2024, as occupier moves to upgrade and/or consolidate prompted the release of secondhand stock back into the market. UK-wide supply of secondhand space increased by 27% year-on-year to 30.9m sq ft, while new and refurbished space increased by 9% year-on-year to 53.3m sq ft.
By size-band, the large segment saw the strongest rebound in supply in 2024, rising 23% year-on-year to leave the availability rate at 8.5%. This segment is the most well-supplied relative to demand, equivalent to 2.8 years of average take-up. In contrast, the XL segment is the tightest supplied, equivalent to only 1.1 years of average take-up and an availability rate of 5.1%. Options are acute at the very large end of the market, with only four built units above 500,000 sq ft available across the UK.
Source: LSH Research
VOIDS CREEP UP
For deals transacting in 2024, the average unweighted void period across the UK was 11.4 months, rising from 8.5 months in 2023. This rise reflects a combination of an increased range of options being available, alongside a more cautious mindset among occupiers in view of the economic headwinds.
Meanwhile, for currently available built supply, the average void period across the UK stood at 13.9 months, rising from 11.5 months in 2023. However, voids vary significantly across the UK, with the East of England showing the lowest average void period at 7.2 months, compared with the North East at 19.1 months. At the segment level, mid-box has the lowest average void length at 13.5 months, while XL segment voids average 15.2 months. Hence, despite having the lowest availability rate, XL units are taking longer to secure an occupier.

Source: LSH Research
XL DRIVES SPEC DEVELOPMENT
Levels of speculative development have recovered to a degree in 2024, reflecting improving access to finance and a rebasing of land values seen in the wake of the severe correction of late 2023. At the end of 2024, a total of 16.9m sq ft was speculatively under construction across the UK, up 18% year-on-year.
However, this was driven by a revival of activity in the XL segment, where spec development under construction has leapt 59% year-on-year to stand at 7.6m sq ft. Despite the higher risks, the shift arguably reflects increased confidence in this segment of the market, with large format supply aiming to meet the demand for larger, consolidated facilities. In contrast, spec development under construction in the large and mid-box segments slowed marginally during 2024, down 2% and 5% respectively.
Four regions saw a fall in total spec development, while the North West overtook the East Midlands as the UK’s most active region for speculative development, with 4.1m sq ft underway at the end of 2024. Yorkshire and the Humber is home to the UK’s largest unit under construction, a 768,800 sq ft facility at Panattoni Park Central A1[M], Doncaster.
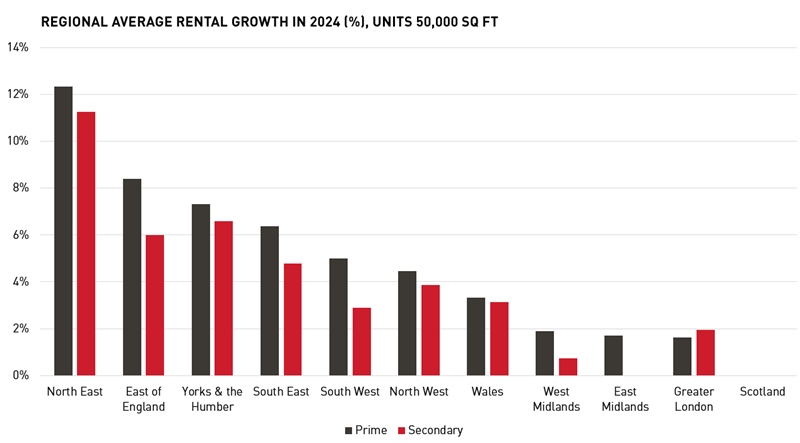
RENTAL GROWTH EASES
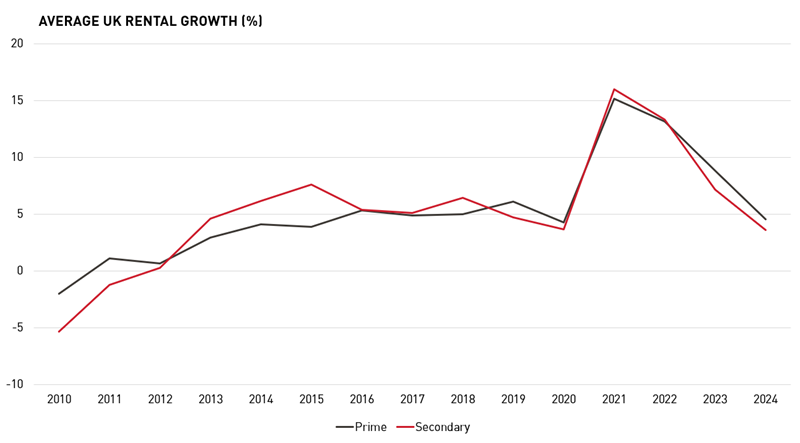
The pace of rental growth slowed for a third successive year in 2024, but nonetheless remained firmly in positive territory at the UK-wide level. Across the UK’s 60 key markets, average prime rents for circa 50,000 sq ft units increased by 4.6% over the year to Q4 2024, slowing from 8.8% in the previous year.
Source: LSH Research
With annual growth of 12% and 8% respectively, the North East and East of England recorded the strongest growth at the regional level during 2024. At the market level, Hemel Hempstead recorded stand-out growth of 26% during 2024, while elsewhere, Fareham (+21%) and Darlington (+15%) saw some of the strongest rates of growth across the 60 key markets.
Despite the increase in secondhand supply, secondary rental growth also eased back but remained firmly in positive territory. Across the 60 markets, secondary rents increased by 3.6% over the year to Q4 2024, down from 7.2% in Q4 2023. Given occupier flight to quality and the sizeable rise in secondhand supply, secondary rental growth is likely to underperform prime again in 2025, further widening the gap between prime and secondary rents.
Source: LSH Research
MARKET Insight
Industrial & Logistics Market 2026
Get the full version of our market leading report.
Download PDF